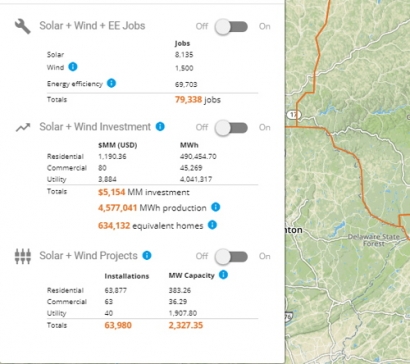
The map is a free-to-use public resource that covers investments, jobs and projects in the US wind, solar and energy efficiency sectors. The project is supported by a diverse group of organisations including the Alliance to Save Energy, League of Women Voters, the BlueGreen Alliance and Operation Free, among others.
The map provides data from the latest industry sources and examines the contribution clean energy is making to the national US economy and downwards to the individual state electoral district level. It enables users to understand more about how investments in clean energy projects impact the local, state and national economy, driving policy decisions around energy.
“In 2018, every level of government is facing decisions that will shape the future of our country’s energy landscape” said Kateri Callahan, President of Alliance to Save Energy. “Current conversations around traditional energy sources focus on job creation and the economy. However, when discussing the economic potential of energy efficiency and renewables the same opportunities are seldom presented. This map serves an essential purpose – to empower citizens, and their political representatives, with a better understanding of the energy landscape and the economic impact of clean energy investment down to the local level.”
The map was developed by Kevala Analytics Inc. It consolidates current, credible and publicly available data on the clean energy sector and will be updated semi-annually to allow users to access the latest renewable energy data.
For additional information:

