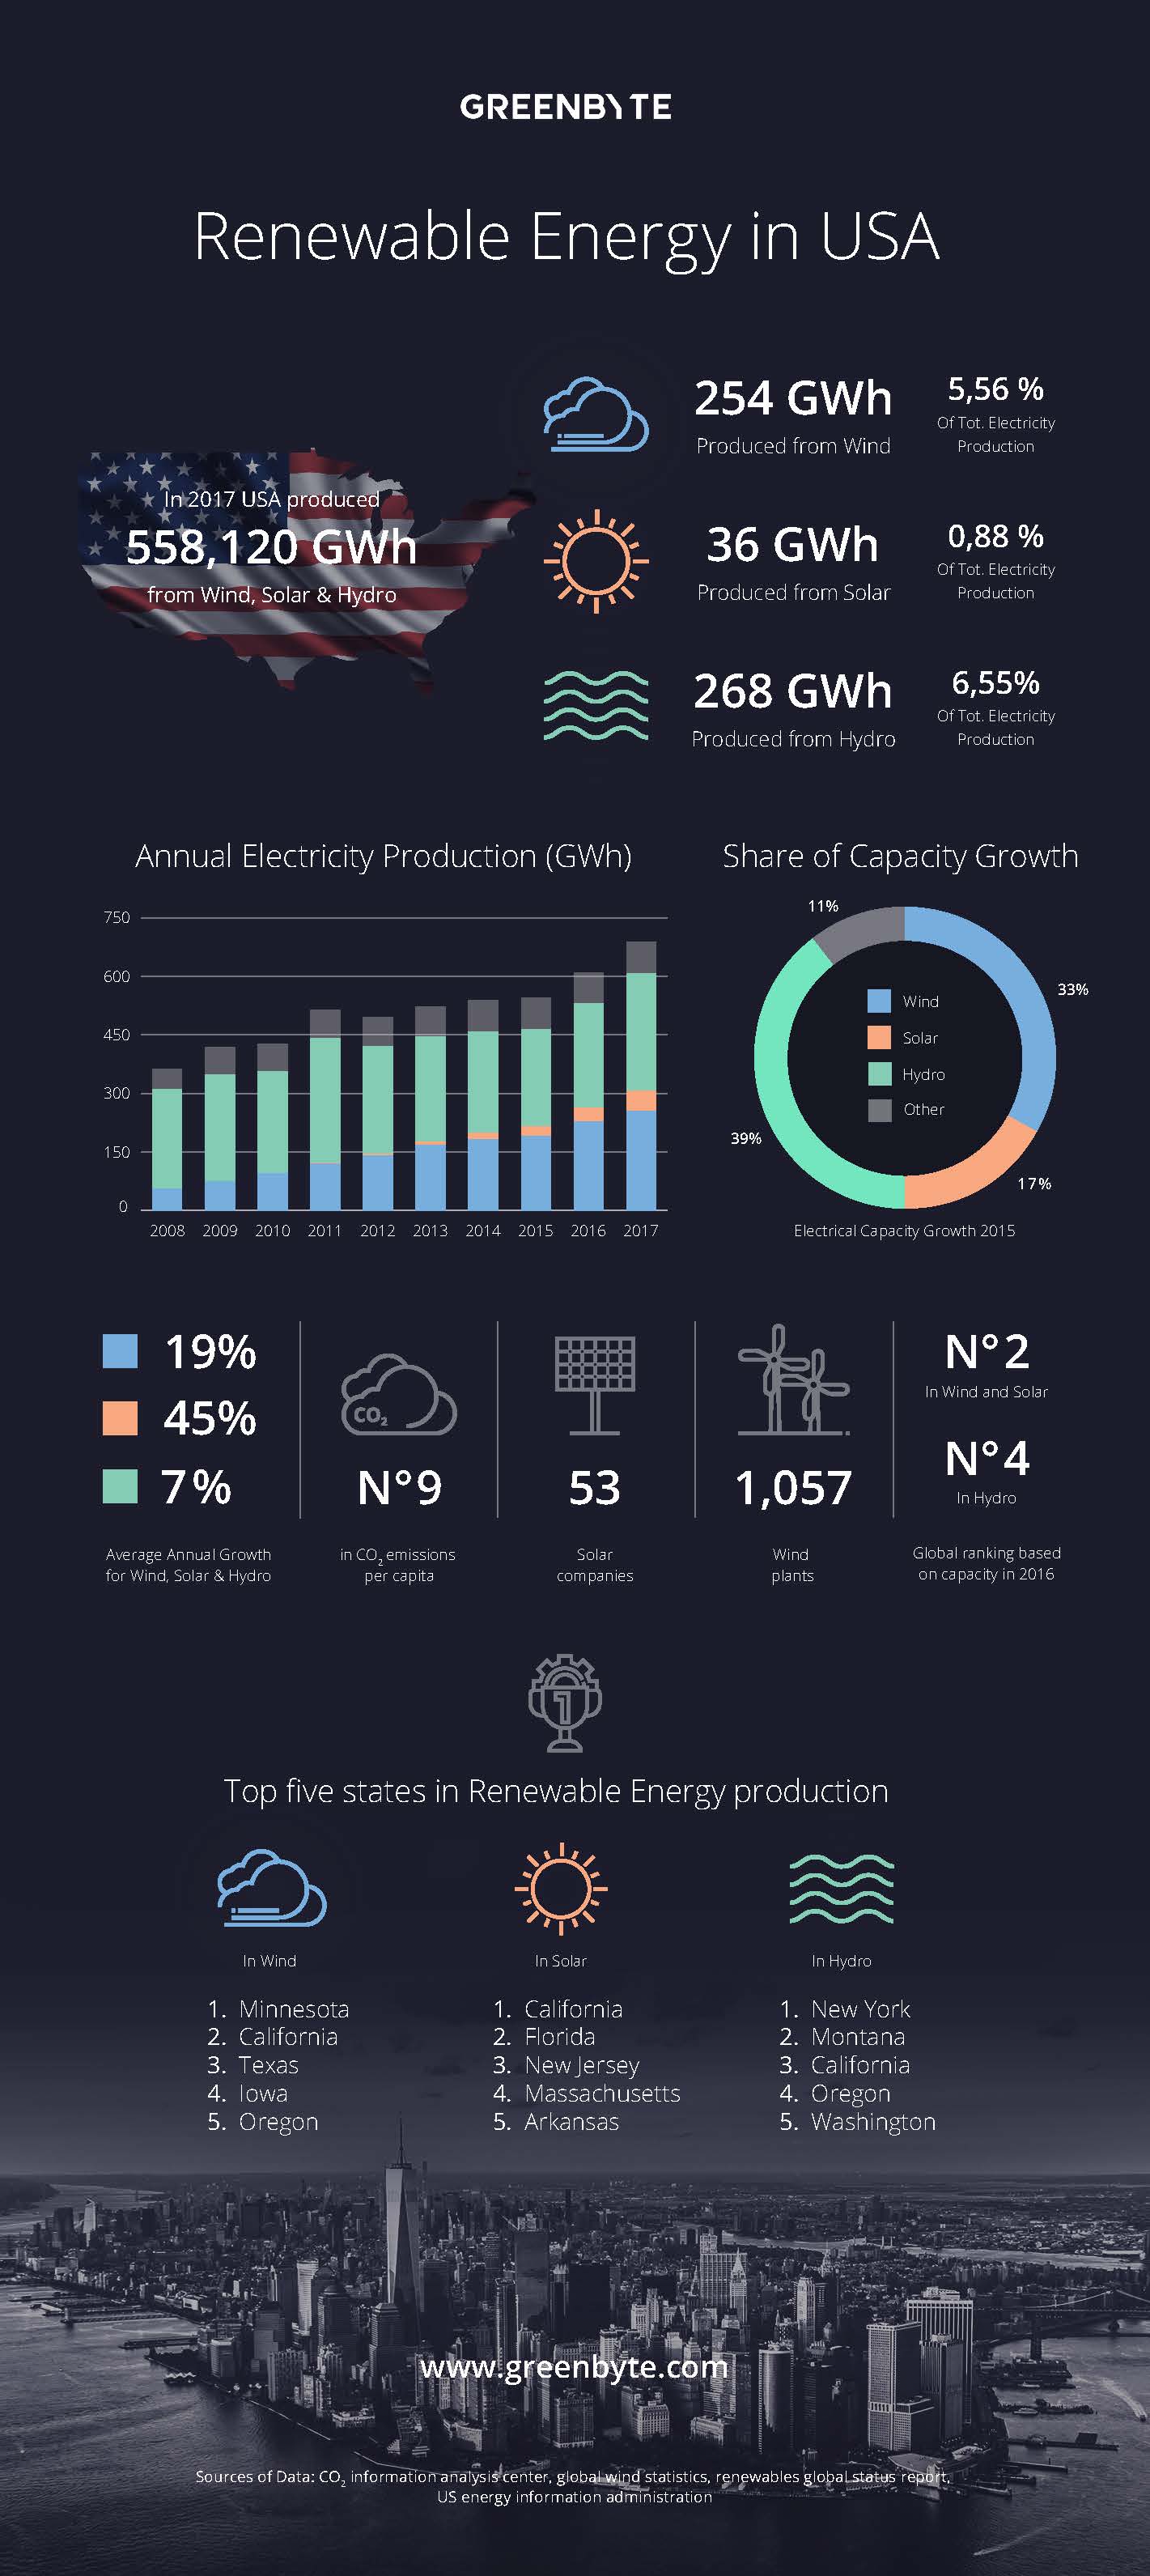
The infographic focuses on data for wind, solar and hydro, highlights renewable energy production, the most recent data for capacity growth, the states topping the renewable charts and other thrilling facts about the renewable energy industry in the USA.
“Continuing our infographic tradition, we were amazed to see the growth in renewables in the USA. The numbers keep going up and USA appeared to be a leader in renewable energy for the past years. It is also interesting how each region makes use of their own natural renewable energy resources, as different states top different energy charts. Overall, the data in the USA infographic was an interesting reveal for us and gave us a clearer insight in the industry. We aim that it does the same for all the readers,” said Fredrik Larsson, CMO at Greenbyte.

