Hitting 92.5 GW for the year, the figure surpassed expectations of 86.4 GW, despite additions falling by 25 percent compared to 2020.
The findings are set out in a new report called Global Wind Power Forecast - entering boom phase by 2025, which is published today.
Overall, China accounted for a leading 51 percent share of global wind additions, followed by the USA (15 percent), Brazil (4 percent), Sweden (2 percent), and Turkey (2 percent). European nations accounted for just 18 percent in their entirety, with strict planning requirements plaguing the onshore sector, with the EU-27 installing less than half of what should have been installed to stay on track with its Fit-for-55 decarbonisation plan. All but two European nations actually saw a decrease in annual installations.
With more dependence on government-related planning restrictions, as well as prices for commodities such as steel, the wind industry has not grown as consistently as solar. While additions have risen at a CAGR of 8.5 percent over the past 10 years, there have been five cases where there has been a decline in global activity in successive years.
For 2021, representing the second largest year for annual additions, the 25 percent dip in installations is largely a result of a flurry of activity in China at the end of 2020; project developers in the country rushed to get projects online ahead of subsidy deadlines at the end of January 2021.
“Despite a 34 percent drop in overall Chinese additions, it was this same dynamic, replicated in the offshore wind sector, that has once again pushed China to market domination in 2021” said Harry Morgan, Rethink Energy’s wind power analyst and lead author of Global Wind Power Forecast - entering boom phase by 2025. “Accounting for 36 percent of the country’s new capacity, in one year, China managed to install more offshore wind capacity than the rest of the world has in the past five years combined. Bringing China to 27 GW of offshore wind capacity in total, it has now blown the UK’s market lead out of the water – with the UK sitting on just 11 GW.”
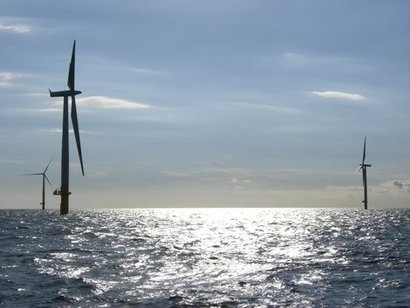
In total, while onshore wind additions fell by 36 percent globally, offshore wind additions more than doubled – reaching 19.3 GW for the year. The technology accounted for 21 percent of total wind additions, up from 6 percent last year. While this figure may not be sustained as Chinese additions dip in 2022, the overall share that offshore wind holds in the market will continue to rise as new countries – including the USA and Japan – rush into the market.
Activity across both onshore and offshore segments sees the global wind power capacity rise to 836 GW, with 39 percent of this sitting in China’s territory –2.5-times more than its nearest competitor, the USA.
This means than wind power now accounts for 11 percent of global power generation capacity (in GW), with total generation (in GWh) growing 5-fold to now account for 8 percent of overall supply.
In a year of soaring commodity prices and logistical costs, turbine OEMs and developers have battled tight margins to surpass their expected production capacity growth. Of the OEMs, Vestas regained its crown as the leading supplier – accounting for 16.4 percent of the market – ahead of China’s Goldwind (13.0 percent), Siemens Gamesa (9.3 percent), Envision (9.1 percent), and General Electric (9.0 percent). GE fell from the top spot in 2020, with its installations in its home US market falling by 22 percent year-on-year.
For additional information:

